



Measures, Not Indicators: Why the Number Improves but the Work Doesn’t
The monthly review meeting goes the way everyone likes it. The screen shows a green dashboard, every indicator at target or above. Managers nod, and the director thanks the team. Downstairs, in the maintenance room, the staff know the picture on the screen is not the picture they live with every morning: requests that come back again and again, and customers calling about a request they were told was closed.
In this article we will see that this scene is not a people problem. It is a design problem. We will follow one hypothetical case, Hind, who owns the maintenance-request process in a services unit, from the moment of a false green number to the moment an honest measure starts changing her decisions. You will leave with a clear line between the indicator that serves leadership and the measure that serves the process owner, with steps to set one useful measure for a process you own, and with a question to ask your team: does this number light the way, or does it judge?
Hind and the Green Number
Hind is responsible for the maintenance-request process. Her team is small, and requests arrive from everyone in the building: a dead air conditioner, a door that will not close, a burnt-out light. A year ago her process was given one indicator and one target: close every request within twenty-four hours. The indicator appears on the management dashboard each month, and the result feeds into the team’s appraisal.
In the first months the dashboard was green. Hind was pleased, and so was management. Then she noticed something odd. A colleague from the third floor calls to say her office air conditioner is still broken, though the system shows the request closed three days ago. Hind opens the record. A technician closed it two hours after arriving, with the note “inspection done”, and a new request was opened for the same fault.
The technician did not lie. He simply understood what was asked of him. A green number was asked for, and a quick closure delivers it. The air conditioner is not discussed in the monthly meeting.
“When measurement becomes a tool for judging people, it stops being a tool for understanding reality.”
Where the case stands now: Hind has a green number and a real problem, and she cannot prove the second with the first. Her data says all is well, and her customers say otherwise.
Try it now: pick a green number in your reports and ask the person who does the work behind it: does this number describe what you actually experience? Write down the answer as given, without defending the number.
What Happened? Goodhart’s Law
What happened to Hind has an old name. In 1975 the British economist Charles Goodhart made an observation that sounded technical but describes human behavior in every workplace. In short: when a measure becomes a target, it ceases to be a good measure.
The idea is simple. Normally a number records a reality that exists on its own. But once people know the number will be used to appraise, reward or punish them, their behavior changes. They do not try to improve reality. They try to improve the number. This is entirely rational, not corrupt. A person responds to the system he has been placed in.
Examples are plentiful. In one health system a strict target was set for emergency waiting time, and some hospitals began keeping patients in ambulances outside the building, because the waiting clock only starts at entry. The number improved while the patient suffered more. The target was met on paper and collapsed in reality.
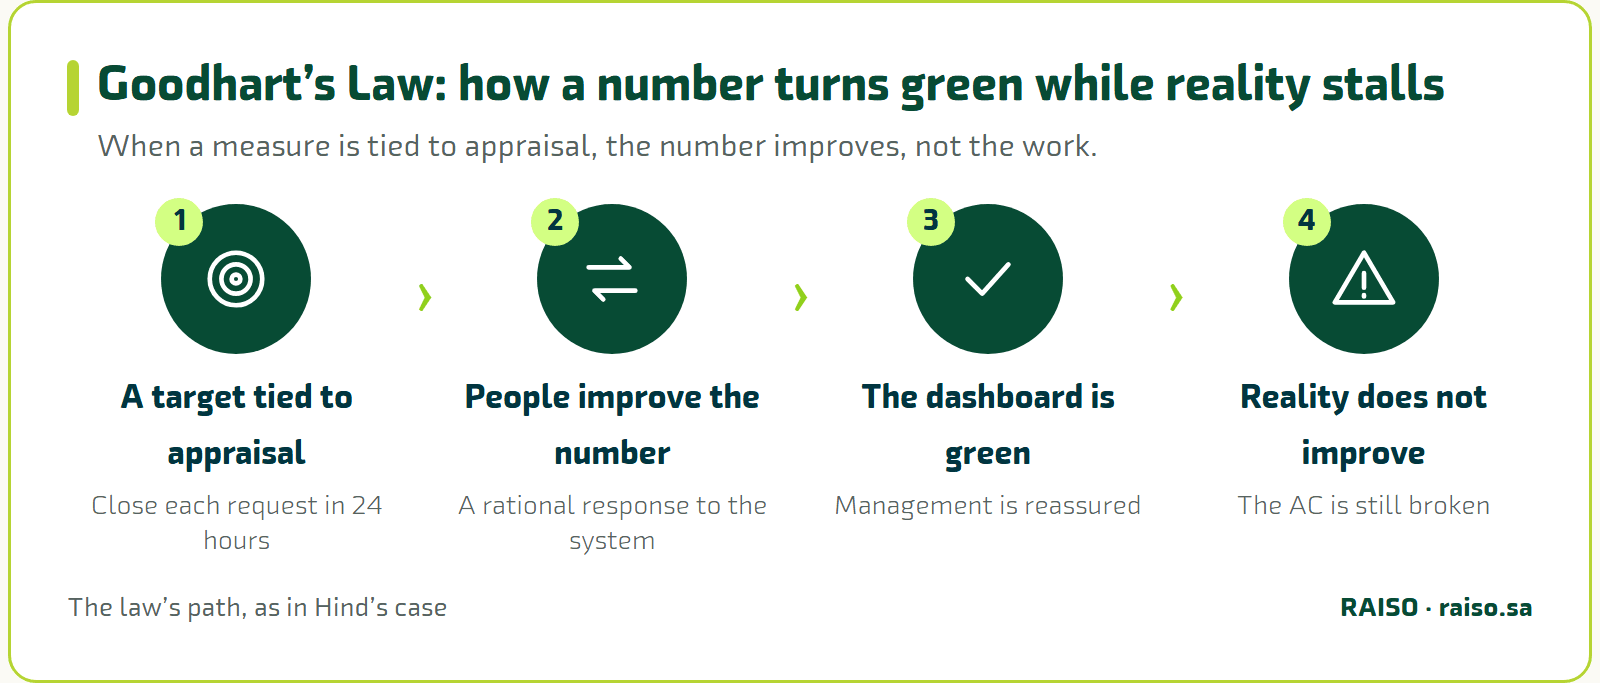
In everyday operations the law takes forms every process owner recognizes, and Hind has just seen the first one:
- Phantom closure: closing the request before it is solved so the time target is met, and watching it return.
- Reclassification: moving a complex case into another category so it leaves the late list.
- Strategic delay: not logging a problem until a solution exists, so it never shows in the data.
- Cherry-picking: taking the easy cases first and postponing the hard ones to lift the average.
All of these are flaws in the measurement system, not in the individuals. So the practical rule is clear: any measure you tie to a reward or a punishment, expect the number to improve while reality beneath it stays the same, or gets worse.
Where the case stands now: Hind understands that her technicians are not careless. They are responding to a target placed over their heads. The problem is not them. It is a number that was made their judge.
Try it now: for a process you know, list two tricks someone could use to improve a number tied to their appraisal without improving the work. If you find them easily, the number is exposed to Goodhart’s law.
Indicator or Measure? The Distinction That Saves the Process
Before Hind’s decisions can change, she has to separate two words we often use as one. The first is the key performance indicator, a tool for leadership. The second is the process measure, a tool for the process owner.
The indicator works at the strategic level. It answers: are we moving toward our big goal? It is read monthly or quarterly and serves senior leadership and the board. When it turns red, a strategic decision is needed: redirect resources, adjust a goal, or review an initiative.
The measure works inside the process itself. It answers: what is happening in this process right now? Is it stable or erratic? Improving or deteriorating? It is read daily or weekly and serves the process owner and her team. When it shows a deviation, direct operational action is needed: inspect a particular step, handle an exception, or ask for help.
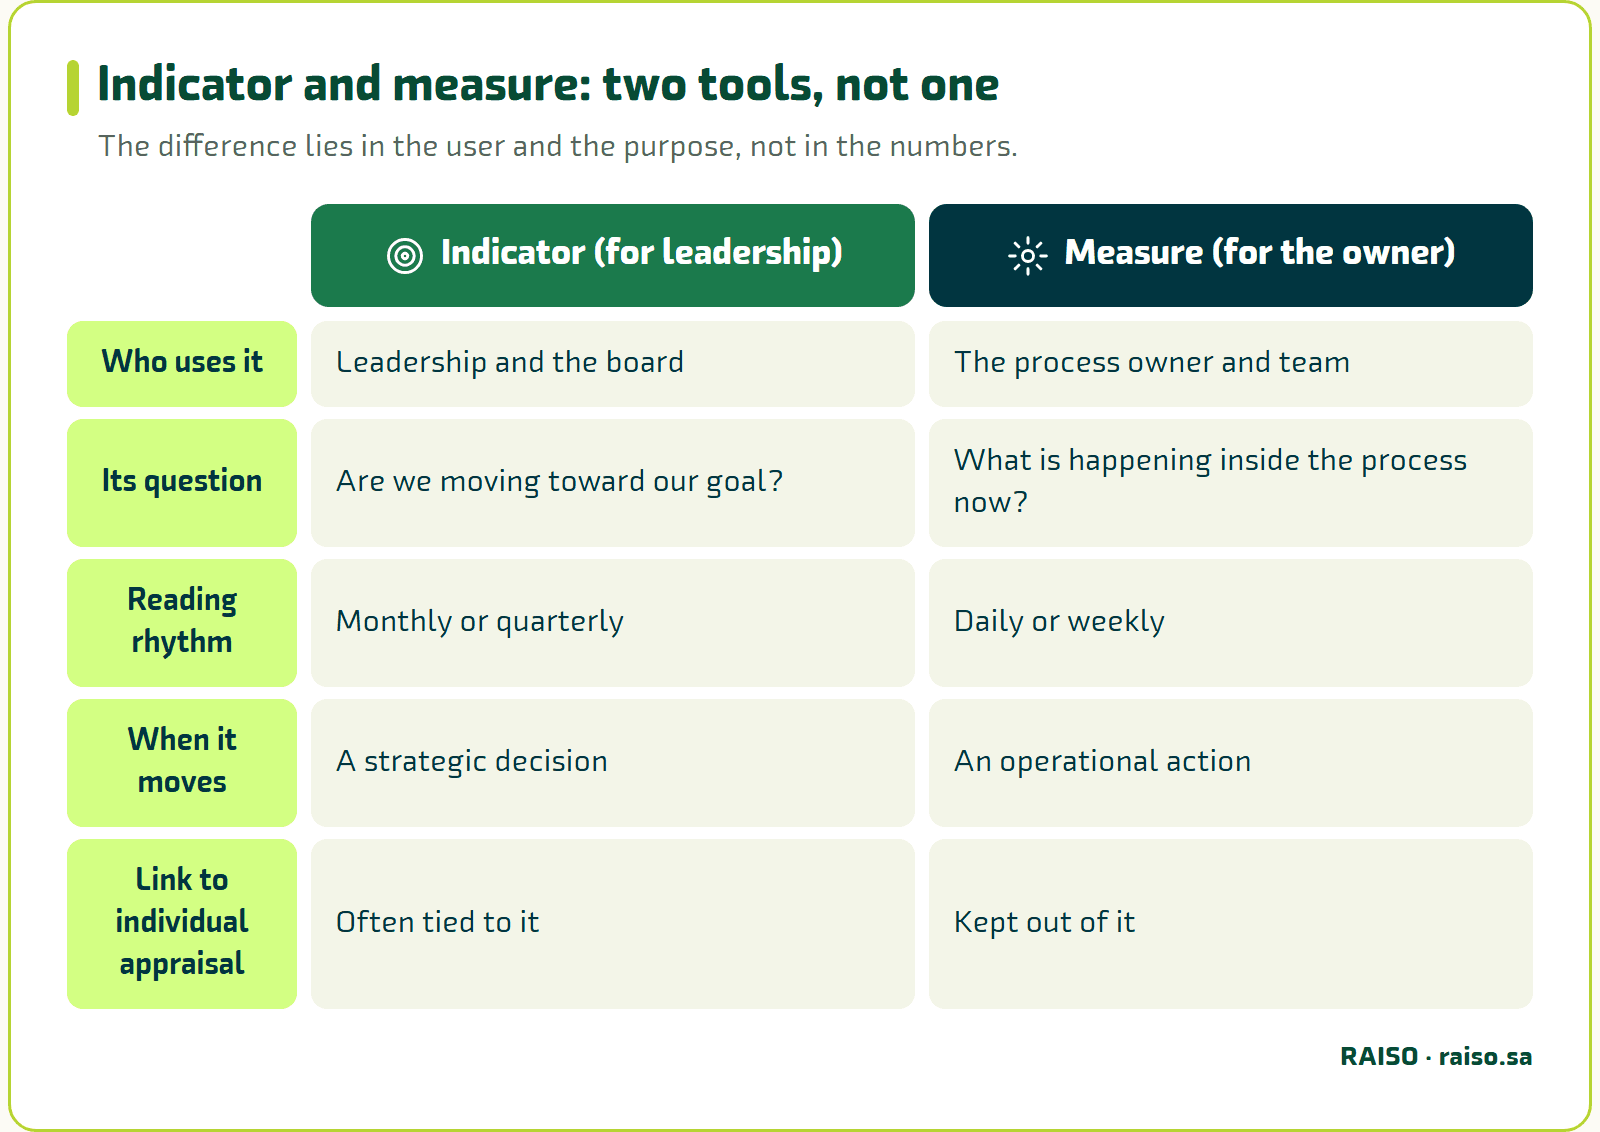
The difference is not in the numbers. It lies in five things:
- The user
The measure belongs to the process owner, the indicator to leadership.
- The purpose
The measure understands process behavior; the indicator tracks a strategic goal.
- The question
The measure asks: what is happening inside the process? The indicator asks: did we reach the goal?
- The kind of action
The measure leads to operational improvement; the indicator leads to a strategic decision.
- Link to appraisal
The measure does not enter individual appraisal; the indicator often does.
The most common mistake is to take an indicator designed for leadership and drop it on the process owner’s desk as a pressure tool. The result is the worst of both worlds: distorted data below and wrong decisions above, built on it. This is exactly what happened to Hind. The leadership indicator, closure within twenty-four hours, travelled down to the technicians and became a punishment.
A process owner does not need a target to be judged on. She needs a measure that shows what the naked eye cannot. There is a big difference between giving someone a task and holding them to account, and giving them a lamp for the road while they carry it out.
Where the case stands now: Hind sits down and sorts her numbers. “Share closed within 24 hours” looks like a leadership indicator, not a tool for her. What she needs is a different number: one that tells her whether a request was truly closed or came back.
Try it now: take three numbers from your dashboard and write beside each: who uses it, and what decision do they take when it moves? If you cannot find a decision, the number is decoration.
Fear Corrupts Data: What Deming Taught
W. Edwards Deming was a quality expert, but first a thinker about systems. One of his deepest insights is that most performance problems are not individual neglect or lack of skill, but a flaw in the system people work in. When measures are tied to individual appraisal, people move their energy from improving the system to protecting their position within it.
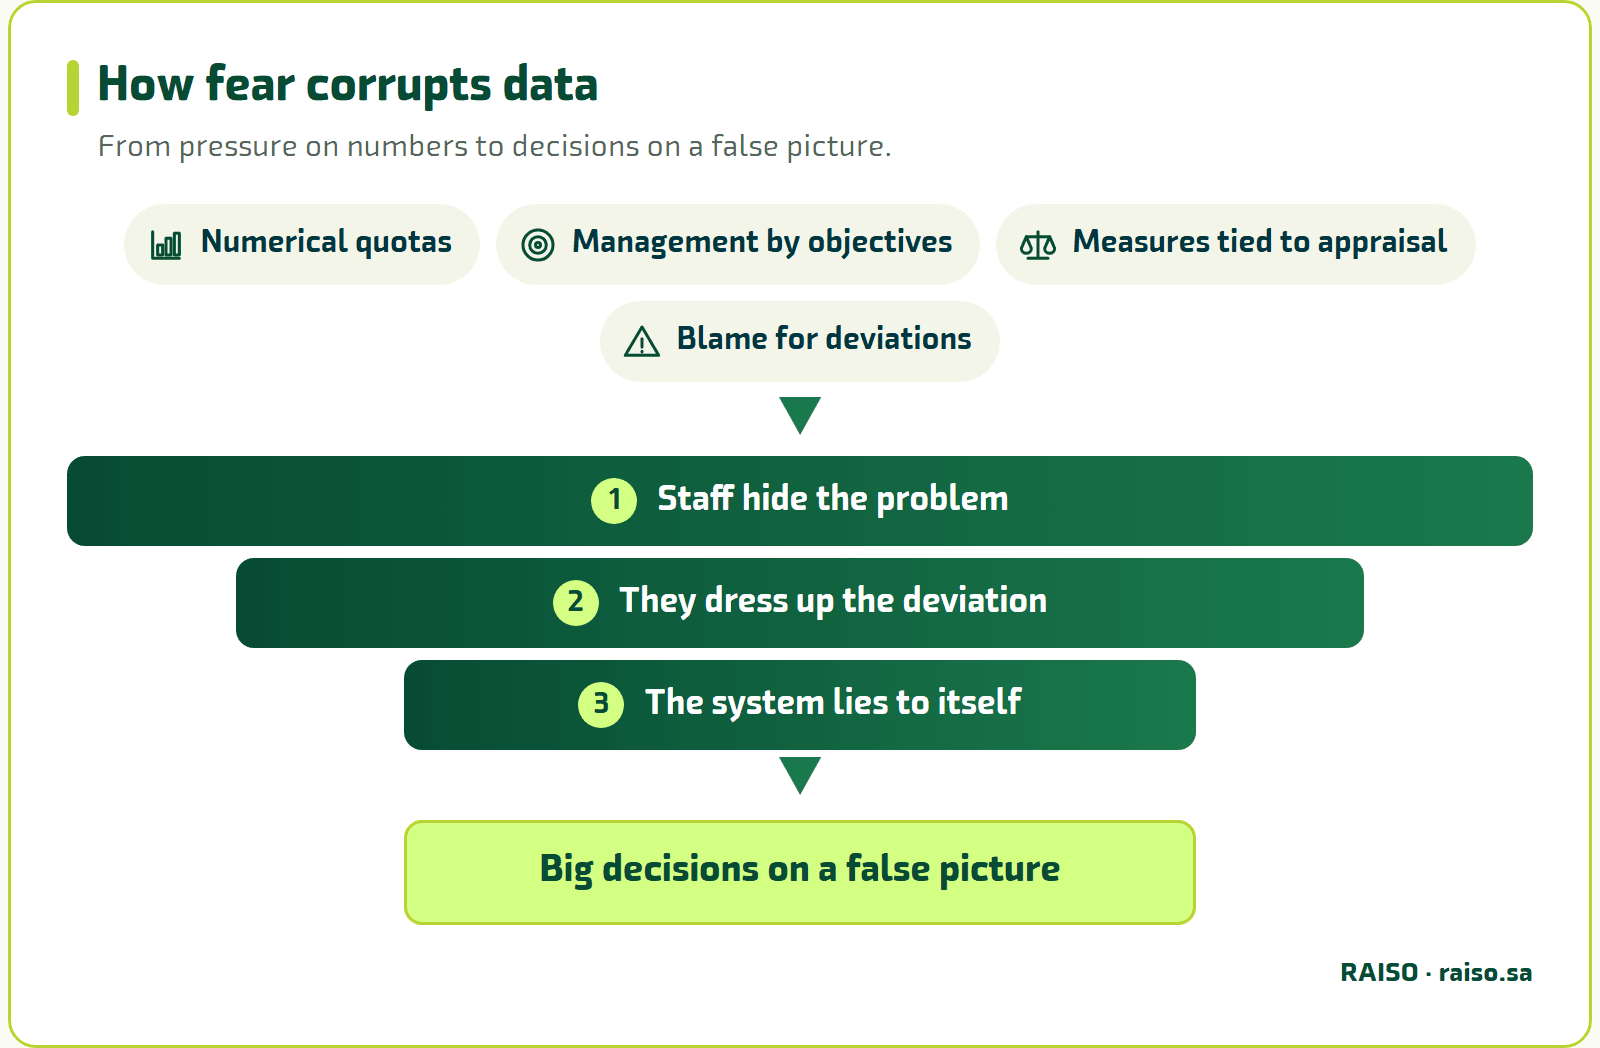
In Out of the Crisis he counted numerical quotas and management by objectives among the deadly diseases of management. He saw management by numerical targets as management by fear, and fear corrupts data. A frightened employee does not reveal the problem; he hides it. He does not report the deviation; he dresses it up. And the measurement system learns to lie to itself, regularly.
In organizations that take this lesson seriously, one thing changes, and it changes everything: people stop fearing bad data. They surface problems early, because they know the number will be used to help them, not against them. Data turns from a threat into an asset.
“Any project to repair measurement starts with culture before it starts with dashboards.”
Where the case stands now: Hind gathers her team and says something they have never heard: “I will not use this process’s numbers to appraise any of you. I want them so we understand our work.” The technicians are silent for a moment. One asks: “Is that real?” Hind realizes that trust is not granted by one sentence. It is proven by what she does afterwards.
Try it now: ask yourself: is my team afraid of its own numbers? Watch how they behave when a number turns bad. Do they explain frankly, or defend?
Natural and Exceptional Variation: Reading a Process Wisely
Once her relationship with the number changes, Hind needs a way to read her figures. In the early twentieth century the statistician Walter Shewhart developed a simple idea that became the basis of statistical process control: not every wobble in a number means something has broken.
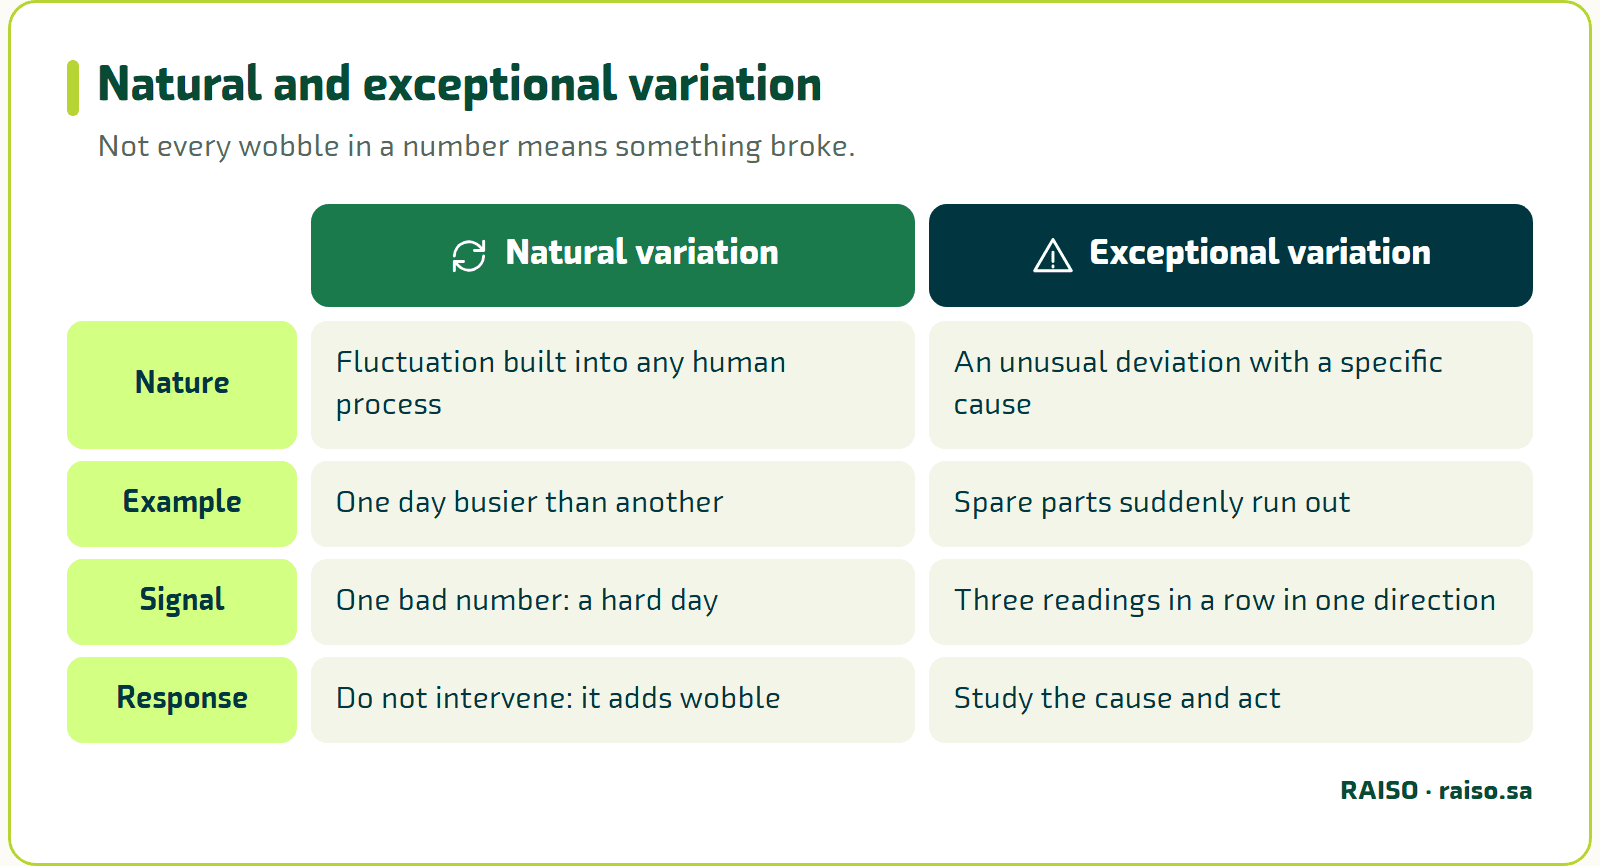
Shewhart distinguished two kinds. Common-cause variation is the fluctuation built into any human process. One day is busier than another, one technician is a little slower because of the type of fault. It needs no intervention, because it is part of the nature of the system. Special-cause variation is an unusual deviation pointing to a specific event that should be studied, such as spare parts suddenly running out or a specialist technician being absent.
Many managers treat every wobble as exceptional. The number drops two points and a meeting is called; it rises and a directive goes out. Deming called this behavior tampering. It does not improve the process. It makes it more erratic, because intervening in a stable process over natural variation makes it less stable.
The wise approach is to plot the number over time, mark its natural range, and ask one question every day: is what I see today normal or exceptional? One bad number may be a hard day. Three in a row in one direction is a trend worth attention. Five outside the natural range is a problem that calls for action.
Where the case stands now: Hind plots the reopen rate over the last weeks. She finds it circles around a certain level, up a little, down a little. But she also sees two consecutive weeks above the range, both after a change of air-conditioner parts supplier. That is an exceptional signal worth studying, not hiding.
| # | Condition | Check question | Met | Partly met | Not met |
|---|---|---|---|---|---|
| The four conditions | |||||
| 1 | No judgment, no punishment | Is the measure used to understand the process, not to appraise or punish its owner? | |||
| 2 | Regular review | Does the process owner look at it regularly to spot the direction early? | |||
| 3 | Recording | Are deviations and interventions logged? | |||
| 4 | Clear intervention limits | Is it decided in advance when a number turns from information into a decision? | |||
| Less is better | |||||
| 5 | Number of measures | Does the process have three measures at most, reflecting its core? | |||
Tick each condition that holds for a measure you own.
Try it now: collect the last ten readings of one measure in a process you own and plot them on paper. Where does the number usually sit? Is there a point outside that range that deserves a question?
The Effective Measure: Less Is Better
Now Hind asks: how many measures should I set? The answer surprises anyone used to crowded dashboards. Three measures per process is the maximum, and the best is one measure that reflects the heart of the process. This is not careless simplification. An owner who follows one measure in depth understands her process better than one who follows ten superficially.
For a measure to really work, it needs four conditions:
- No judgment, no punishment
The measure is for understanding the process, not appraising its owner. This is a condition for honest data, because a measure that is punished becomes a target that is chased.
- Regular review by the process owner
A measure nobody looks at regularly has no value. Regular review shows the direction before it becomes a problem.
- Recorded results and interventions
Every deviation and every intervention is logged. Not bureaucracy, but the memory of the process on the day it is improved, handed over or audited.
- Clear intervention limits
We decide in advance when a number turns from information into a decision, so intervention is not a matter of mood.
Choosing the measure is itself a method, not a hunch. First we understand the core of the process, its main output, and its largest source of variation. Then we pick the measurement point, the step where the greatest impact or the most deviation occurs. Then we set intervention limits. Then we follow trends, not single numbers.
The owner picks from a short list: flow time, request volume, error rate, backlog level, and rework rate. Each process has what suits it among these five, and rarely needs more than one or two.
Where the case stands now: Hind asks: where does my process really break? She finds its heart is solving the problem the first time. So she picks one measure: the rate of requests reopened after closure. And she adds one supporting measure: the distribution of closure times, not their average.
Try it now: write in one line the heart of a process you own: what, if it got worse, would make the customer lose out? That line is your first candidate for measurement.
Remove the Target and Reality Improves
Hind takes a bold decision. She asks her management to remove the twenty-four-hour target as a binding limit for the maintenance process and replace it with a trend measure linking the reopen rate to the distribution of closure times. In other words, she moves from the question “did we close on time?” to “did we close properly?”
What followed taught her a lesson. In the first weeks, average closure time rose slightly, because the technicians stopped rushing closures. But the reopen rate fell clearly. That information had been in the data all along, but the strict target hid it. When the target went, the real story appeared.
In time the technicians began reporting recurring faults to Hind instead of closing them and moving on. They revealed that dozens of requests concerned one type of air conditioner. Hind resolved the root cause with the supplier, and the number of requests fell at its source.
“A slightly slower, honest number beats a faster, false one.”
Where the case stands now: Hind no longer chases a number. She reads her process’s behavior and takes real improvement decisions, and her team comes closer to her instead of avoiding her.
Try it now: ask: if one numeric target were removed from a process in your organization, what would appear in the data that it hides today? Write a guess and test it.
The Process Owner Raises the Flag
In the life of every process there is a critical moment. Its owner realizes that what she sees in her measures is bigger than she can handle alone. An unprecedented backlog, a persistent deviation that usual remedies do not touch, a systematic decline pointing to a problem deeper than her role’s authority. The right professional response is to ask for help. This is not an admission of failure. It is a conscious decision that shows understanding of the problem and the limits of the available fix.
But this behavior does not occur in every environment. If numbers are used for accountability, the process owner learns that showing a problem hurts her, so she hides it or treats it with inadequate tools. When numbers are for understanding, she can say with confidence: “My measures show a continuing deviation outside my reach, and I need help.”
When an owner raises a flag backed by clear data, she gives those above her a precious gift: a documented problem instead of a general complaint. There is a big difference between an employee who says “I am tired” and one who says “the measures show a rising backlog over the past two weeks and I have exhausted the available solutions.” The first asks for sympathy. The second asks for a decision.
Where the case stands now: In the fourth month Hind sees the backlog rising for three consecutive weeks, caused by a shortage of air-conditioning technicians beyond her authority. She goes to her manager with one page: the chart, the natural range, what she tried, and what she asks for. He approves a temporary contract the same day.
Try it now: prepare a four-line “flag” template: what does the measure show? Since when? What have I tried? What do I need from above?
Separating the Two Floors: Indicators Above, Measures Inside the Process
Someone may ask: do we then abolish performance indicators? No. The problem is that the indicator left its place. Its place is the strategic floor, where leadership works and follows big results: overall customer satisfaction, business volume, growth rates. They are measured monthly or quarterly and support big decisions.
On the operational floor, process owners work with daily and weekly measures. Their question is different: are our processes in normal health? Is there a deviation that calls for action? The danger is that the indicator descends to the lower floor with its accounting logic. That leak is the germ that corrupts measurement from inside, because it loads the diagnostic tool with the burden of accountability, and the tool loses its honesty.
Separation does not mean the floors are strangers. The relation between them is feedback, not accountability. Picture a pyramid of three layers. At the base are process measures, owned by the process owner and describing daily behavior without direct accountability. In the middle are value-chain measures, owned by the process manager and describing a group of linked processes. At the top are the strategic indicators, owned by leadership and describing progress toward the big goals.
So Hind’s “maintenance request handling time” feeds the value-chain manager’s “average service delivery time”, which in turn feeds leadership’s “employee satisfaction with service speed”. But linking does not mean equating. Hind’s measure stays an operational tool in her hands, even if it feeds a strategic indicator. Turning it into a performance indicator on the pretext of “linking it to strategy” is the very mistake we started with.
A third role remains for the organizational excellence team. It neither runs the processes nor holds their owners to account. It follows improved processes to make sure the improvement lasted, watches critical processes for leadership with an objective eye, and measures the health of the measurement system itself: how many processes have an effective measure? How many improvement projects were completed and sustained?
Where the case stands now: Hind presents her small pyramid to management. “Employee satisfaction with service speed” stays an indicator on the monthly dashboard, and “reopen rate” stays in her hands alone. At next month’s meeting the dashboard speaks more honestly, because honest numbers rise to it from below.
Try it now: draw a three-layer pyramid for a process you know. Put one measure in each layer, name its owner, then ask: does any number descend from above to become an accountability tool below?
What You Take With You
We are back at the monthly review meeting, but in a different version. Hind’s dashboard is not all green, and that is exactly what makes it useful. It has a clear red spot with an understood cause and a plan, and a trend improving at a real, slow pace. The director does not ask “who is responsible?” but “what do we need?”
If five ideas stay with you from this article, let them be these:
- The number you are held to improves, while the reality beneath it may not. That is Goodhart’s law.
- The indicator is for leadership and strategic accountability; the measure is for the process owner and operational understanding.
- Fear corrupts data, and repairing measurement starts with culture.
- Read the trend, not the single number; tell natural from exceptional variation; do not intervene in a stable process without cause.
- One measure, three at most; no judgment, no punishment; and a flag ready for when the matter exceeds your reach.
One question to leave with you: in your organization, which process has owners who are held to a number they know does not describe their work? Start there. Sit with its owner for an hour, choose one honest measure with them, and try a month without a binding target. To go deeper into building process measures and the process-owner approach, we invite you to explore RAISO’s course on process measurement and improvement, and to apply it to a real process you own.